
My name's Matt Graney, I'm VP of Product at Celigo, we're based in San Mateo, California, where we are a Series B startup.
In this article, I'm going to talk about building the metrics that matter to product leaders. Celigo is an integration platform but the lessons I cover will apply no matter what product you're involved with.
In our particular case, we had the advantage of being steeped in the integration world and looking at the role of integration in terms of getting the data where it needs to be so that we can better understand the state of our customers, their overall health, and use that effectively to drive retention and growth of our business.
Product leaders should focus on retention
The first thing that hopefully is nothing new to you is of course, that product leaders need to be thinking about retention. This isn't just about building new features, it isn't just about working on technical debt, or whatever it might be, the goal always has to be focusing on retention.
According to this study, it costs four times more to acquire a new customer versus selling to existing.
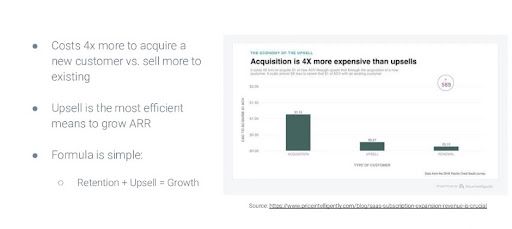
Upsell is the most efficient means to grow ARR
This really has always been the premise of a SaaS business in that it's good for the buyer and it's good for the vendor because everything is right-sized.
Hopefully, the customer begins by only buying what they need but there's this ongoing expectation that if the product is successful, it will expand. You're already into an account, you've already planted some seeds, laid hopefully a solid foundation and there is a great growth opportunity from there.
Compare that to the cost of sales for a net new deal having to prospect, do a lot of marketing, whatever it might be. Obviously, in Celigo's case, we're a B2B software company but I think some of these same lessons would apply to B2C as well.
It's clearly going to be a lot easier to sell to existing customers than going out to acquire new ones, and ultimately, is efficient.
Retention + Upsell = Growth
Of course, the formula we should always be thinking about is our growth is driven by our retention, and our upsell. Retention, of course, takes into account churn that may occur. But the upsell is really where the big opportunity lies.
The questions then become, how do you know who's going to churn? How do you know where your opportunities are to upsell?
Product usage data powers the upsell flywheel
The upsell flywheel is critical here but it has to be powered by data. I'm talking here about usage data.
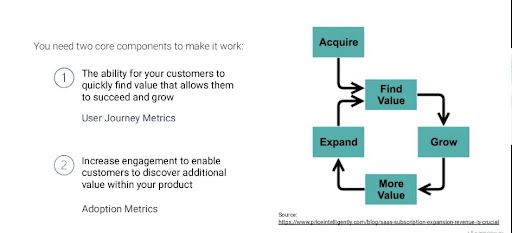
There are two aspects to this.
- User journey metrics
The first is around the user journey.
- How quickly can users find what they're looking for?
- How can they solve their own problems in their first contact with your product?
2. Adoption metrics
Then, over time, how can their increasing engagement allow them to find additional value?
This we would refer to as adoption.
You can think of the user journey as maybe focusing on an individual user and adoption talking about the entire account.
As sort of an anti-pattern of this, imagine an account where you've sold your product, but there's only one user, there's that main point of contact, the champion who maybe had to go into bat for you to win the business. What happens if that person leaves?
If there's no champion anymore, you will see usage plummet. This is the sort of thing that inevitably will drive churn. The next time the subscription comes up for renewal, someone in accounting or the CFO is going to ask some tough questions, and there'll be no one to stand up for you.
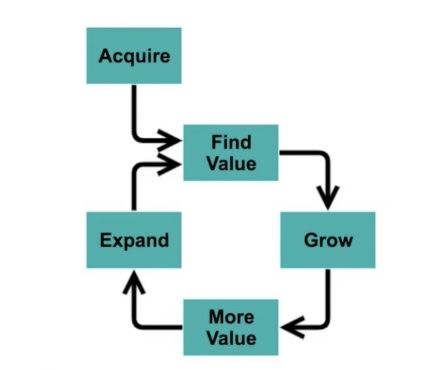
It has to be a combination of getting that initial usage and then building the flywheel. This graphic really captures that initial acquisition, quickly finding value, and then finding paths to growth that deliver yet more value, leading to expansion, and so on in this virtuous cycle.
That's why it's referred to as a flywheel where power just keeps being applied and momentum builds over time. This is really one of the keys here. As you'll see, data is really important in terms of understanding where your customer is in this adoption flywheel.
Reading the signs
The way we think about it at Celigo, and I'd encourage you to consider this is to think about the model here in a classic two by two grid, where we have on the x-axis, the user journey, from one that's negative through to idyllic and positive. And adoption on the y-axis, where we’re talking about limited adoption through to a quite broad adoption.
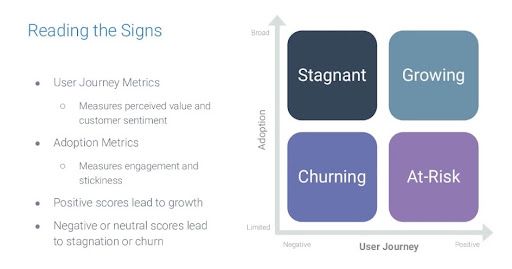
On the user journey side, we're looking for the measures that best align with the way the customer perceives value and their overall sentiment.
And from an adoption point of view, looking at breadth here, it's engagement, stickiness, frequency of use, and so on.
Churning
From this grid point of view, you can imagine the worst-case scenario is being in the bottom left - very negative sentiment from a user journey point of view, and very limited adoption. Again, the next time that subscription comes up for renewal, you're going to be probably in a bit of trouble.
At-risk
If we go to the bottom right, if the user journey is actually quite positive, but the adoption is still limited, you remain at risk. Again, it's this example of where there might just be a single champion or a single user at one of your customer accounts.
If that person leaves or there's a reorganization, there's M&A activity, you're not going to have enough champions to go into bat for you.
Stagnant
In the top left, we get to a point of stagnation where you might have somewhat broad adoption, but no one likes it. I think we've all used products that you sort of hold your nose, and no one loves it at all, it kind of does the job.
At that point, it's unlikely to grow any further, and probably given half a chance, if a more attractive competitor comes along, the customer is going to churn out.
Growing
Of course, where you want to be as always with a two by two grid is in the top right where you have an overall positive user journey, good sentiment, and adoption that’s broad.
This is where you really get to the point of growth. In our case here, what does that mean for Celigo?
Metrics that matter
I'm going to focus mainly on the right-hand side of this image, but just broadly, we built a health score that is a combination of these user journey metrics and adoption metrics.
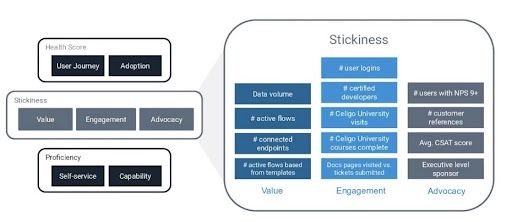
Stickiness
From a stickiness point of view, which really relates to adoption there are three aspects to this; value, engagement, and advocacy.
We can also talk about proficiency, I won't talk about that too much in this article, but briefly, proficiency is the ability of a user to do the job themselves, not to have to rely on your services team or support team or a third party services provider, but to actually do the job themselves and handle increasingly complex use cases on their own.
If we just focus on stickiness for a second, again, in our case, we're an integration platform. An integration platform allows a disparate set of business applications, typically cloud-based applications in the market we focus on, to work together.
So if your sales team is using a particular CRM, your finance team is using a certain accounting system, maybe marketing is using a different marketing automation system, the chances those combinations are all designed to work together is pretty slim.
This is where integration comes in because there are many business processes that have to span multiple applications. Whether it's the HR system for onboarding, the expense management system, the order fulfillment service, whatever it might be.
In our case, it's about connecting applications and the flow of data. I give you that as a bit of context because the metrics that matter for you will be slightly different. But I think you’ll find there are metrics in this context of value, engagement, and advocacy you’ll be able to imagine for your own product as well.
Value
On the value side, we're an integration platform. If that platform isn't moving data and connecting applications, then it's not really delivering value - that really is the way value is experienced through a product like ours.
For that, we want to see:
- Is there a decent amount of data being processed by the integrations?
- How many active integration flows are there? And
- How does that relate to what the customer actually bought?
- What's the utilization of their subscription?
- How many different applications or endpoints are they connecting? And
- How many have they built themselves versus built from templates we might have provided?
Engagement
From an engagement point of view, I think you'll find these are fairly common for many apps:
- How many users are logging in and how often?
- How many are certified or have gone through the learning management system? We call ours Celigo University, have they completed the courses? And
- How often are they actually checking the docs before submitting tickets?
These are the ways users show the degree to which they're engaged.
Advocacy
Finally, advocacy, which I think is going to be broadly applicable:
- Net Promoter Score, how many of ours are net promoters?
- How many are actually referenceable?
- What's the average customer satisfaction score? And
- Do we have executive-level sponsors?
These are the sorts of things we use that all go into the mix for our health score. So how did we actually go about building that?
Transition to metrics-based customer 360
It was a journey and for us, I lead product, but I worked very closely with the head of our customer success organization to take the company on a journey to be much more metrics-based.
Everyone talks about customer 360 but the way to succeed with this is to be metrics-based. This was a joint initiative, really, because there was information from multiple sources, including product, that needed to feed the information the customer success team uses, which in turn informs the decisions my team needs to make on the product side.
Establish customer information visibility
The first was setting a foundation of basic customer information visibility. In our case, we use Salesforce as our CRM and NetSuite as our ERP, this is where all the financial data is going to be captured.
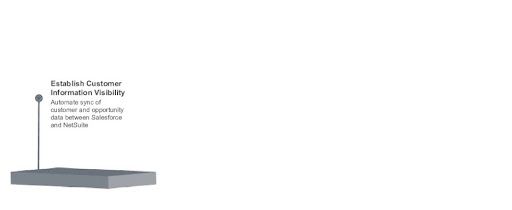
The first thing we did was automate the synchronization of customer information and opportunity information. In our case, that meant once an opportunity in Salesforce reached the closed one state, we would sync that over as a NetSuite sales order.
This began the tight relationship between the customer record in Salesforce and the customer record in NetSuite. This is important because it's almost like the primary key if you will, this is the main linkage between these systems. It's exactly what's used to spread throughout the rest of these phases.
Understand product usage patterns
Company-wide customer health visibility
The next step was to bring to as many stakeholders into the company a better understanding of customer health, bringing that visibility. That meant, okay, now we had the basic relationships in place, how did we understand the way the product was being used?
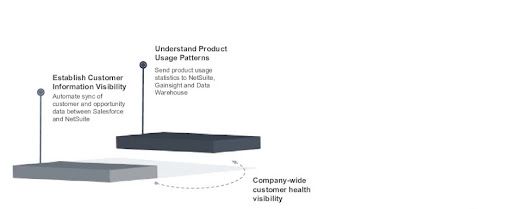
In our case, we began by gathering basic product usage statistics and getting them into various places, NetSuite originally and then onwards to Gainsight CS, which is the cockpit our customer success team uses. And also then to a data warehouse that just collected a whole bunch of other information.
The challenge of data gathering
I think part of gathering information is you don't always know what's going to be valuable. There's this challenge you face because you don't necessarily know what's going to be valuable and yet, once you know it, you really wish you had more history of that data.
Because ultimately, what you want to be able to do with a health score is say, I'm collecting this information, when I go back and look at churn or I go back and look at customers that have expanded the most:
- What are the telltale signs?
- What are the metrics that matter?
- What are the things that best indicate whether this customer is going to expand rapidly?
- Or is going to sink like a stone?
So you have to sometimes collect a little bit more than you think because you don't know for sure yet how these metrics are going to correlate with customer success. This was our first step in gathering usage information.
Improve customer engagement
Identify at-risk accounts
We were then using that to say, what are the telltale signs that show our customers at risk?
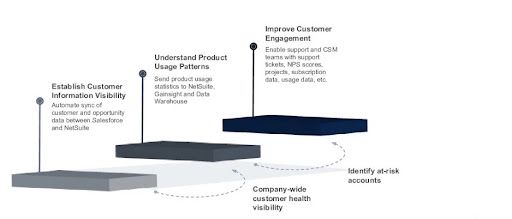
This involved extending the way we engage customers by ensuring everyone was aligned across support and CSMs, that we were gathering NPS data in-product whereas previously we did it via email.
NPS scores
We found it was a much more honest accounting once we did it directly in-product. Email-based NPS tended to provide a bit more of an optimistic view, but not really that realistic. People would say, "Yeah, we love the product" when you ask them in email, and we found the sentiment was actually not as positive when we asked them in-product.
That was really information we needed to know - we're not in the business of trying to kid ourselves with the metrics we collect.
Subscription data
We also needed to improve the customer engagement by making sure CSMs had all in one place the subscription data as well.
- What has the customer bought?
- How much are they using?
- How are they using the product?
All of that information is put together.
- How many support tickets have they raised?
- When is the subscription up for renewal?
Worst case scenario, of course, you're in the renewal phase and then there's a major escalation, it's going to make that renewal conversation very, very difficult.
Increase net retention
Enable proactive interactions
The final thing was to make this much more proactive. We began by just making sure we had enough information so that when a crisis occurred, we could react.
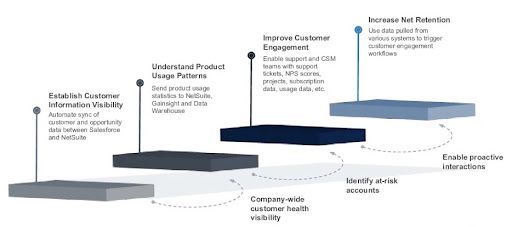
But in terms of optimizing this and getting to a point of increasing retention, it's important to be able to be proactive, to use the information we gather to drive the behavior we want in our CSMs, our customer success teams, and effectively try to head things off before they expand and run out of control.
So these were the primary four steps we went through on our transition to being customer-based.
Summary
At the end of the day, it looks quite complicated, but I'll walk you through it.
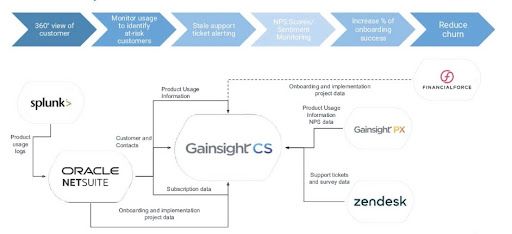
The arrows here represent different integrations. I'm sure you also have information in different systems.
You can see here:
- Support uses Zendesk.
- For in-app engagements, we use Gainsight PX.
- We use Gainsight CS for customer success.
- NetSuite has been our traditional single source of truth as a company.
- Splunk we use for some product usage data. And
- Financial Force increasingly for the way our services teams work.
Customer and contacts
We made sure first that customer and contact information was synchronized across everything which enabled us to build dashboards for CSMs inside Gainsight.
It meant, actually, we could be much more efficient in our CSMs because they had the information they needed all in one place.
Subscription data
We then focused on getting subscription data into Gainsight from the source of truth, NetSuite, into Gainsight. This enabled our CSMs to be much more proactive about knowing exactly where they were, and when's the right time to be really focused on customer usage.
Of course, you'd love to be able to do that all 12 months of the year but it's much more critical during this prime renewal phase. For us, we tend to start the renewal process in about month nine so we really want to make sure everything is buttoned up and in good shape.
Product usage information / NPS data
We then started gathering NPS data, taking information from Gainsight PX, which is a tool that enables you to launch surveys and engagements directly inside our product.
So as the customer is using it, we gather both usage information, which features are they using, how are they using it, and also when they do respond to the NPS survey making sure that data makes it to the right place.
This improved our response rate in the CSMs by more than 5x, just by having the information available, we could see the problems a customer might be having as they evolved, we could identify net new opportunities because of the patterns we could see in the product usage.
The way they were using the product indicated there was a new opportunity for us. It might have just been as simple as noticing they'd used all of their subscription up so there was an opportunity to upsell. This allowed us to react much more quickly than we would have otherwise.
Support tickets and survey data
In the next phase, we made sure all the Zendesk ticket information made it into Gainsight as well. This provided better fidelity to our health score and enabled tickets to be proactively escalated to the CSMs at a certain time.
In Gainsight, you can have certain programs that you run and certain triggers by having the information all in one place. Also employing a tiering strategy, which, again, was in combination between product and customer success team to identify the customers that represent our ideal tier zero customers versus tier-one down to tier three, different types of opportunities that we might see based on the way customers are using the product.
Product usage logs
We then started gathering even more low-level information out of Splunk that we maybe couldn't get purely through the user interface. Again, Gainsight PX is a product that allows you to gather information in the middle of the way a customer is engaging with the product.
But our product as an integration platform, it's middleware, which means a lot of the most exciting things happen when no one's logged in, when an integration is running maybe on a schedule every hour, or maybe it's triggered in real-time when a certain event occurs, that might happen in the middle of the night when no one's even logged into the product.
So in our case, this middleware-based data, it was really important for us to get that data out of Splunk and then route it.
Originally, we had it into NetSuite but we also started piping that into Gainsight, as well as into a data warehouse.
Onboarding and implementation project data
In the final step here, we also included information out of Financial Force, which is a professional services automation tool. This enabled us to save a significant amount of time in onboarding new customers because we could just greatly streamline it, the CSMs were able to easily step a customer through the onboarding process for starting a new project.
And we're also able to get all the project data, what did the sales team actually sell when it came to an implementation project? And again, have it all in one place.
A 360-degree view
The net of all this is it allowed us to get a 360-degree view of the customer, to monitor usage along the way, and look for things that suggested they were at risk.
There are multiple things - it's not just a high number of tickets, it might be very low usage compared to the subscription they purchased. It might be any number of things - maybe there's only one user that ever logs in this is again, one of these telltale signs from the stickiness image I shared earlier.
We look at the alerting from a support ticketing point of view. We're looking at NPS scores and sentiment monitoring, and the percentage of onboarding success. How are customers moving through this overall? And then as a whole team from the CSM point of view, it was about reducing churn.
Product and customer success
You'll notice I'm talking about a lot of things that really relate to customer success. But I would suggest to you, as a product leader, it's not just about your relationship with engineering, obviously, you need to be really intimately tied with the customer success team.
In our case, we were in the middle of growing a CSM team so, in order to onboard a new team, they don't necessarily know the product, they don't necessarily know what's important, it's a matter of marrying together all this information.
- What did the customer purchase and why?
- How are they using it?
- Who's using it?
- How often?
- How complex?
- What's their real capability?
- Are they able to do the job themselves?
In our case, and I suggest it's probably the same in yours as well, this information is in different data silos. You see some of them listed above. There are additional ones I've not mentioned - you don't see Salesforce on here, which is the cockpit for our sales team. You don't see HubSpot on here, which is our marketing automation software.
Where integration comes into play
There's a lot more than this that's going on. But the key is, each of these specialist products brings their own insight, their own piece of data, but you can't really see the whole picture until you bring the data altogether.
Of course, that's where integration comes into play. It's not just about the metrics, it's about actually getting all that data that drives the metrics into the same place at the same time, so it can be properly analyzed, and then ultimately acted upon.
How do you actually go about that?
Automation tips to accelerate time to value
I want to talk about this now in terms of automation. You could gather this information independently and maybe begin by manually putting it together somehow, maybe some giant spreadsheet somewhere.
But overall, and ultimately, you're going to want to automate this to ensure the information flows into the right spot at the right time.
Repeatability is key
The first thing is that repeatability is key, you want to be able to get this data reliably from point A to point B.
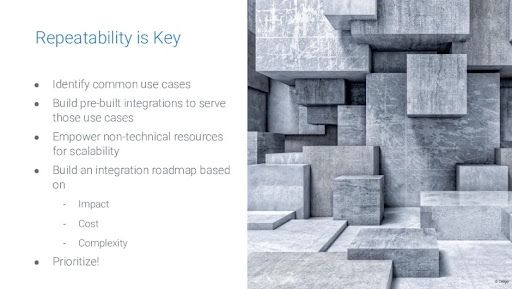
Often, there will be pre-built integrations you can use. Some of the apps I've mentioned here do have out-of-the-box integrations that have been built by the vendors themselves to serve those use cases, and they can really help to get you started.
But you also need to think about whether those integrations are going to do the job for you. Because they're often designed for a happy path, and don't necessarily take into account the nuances of your business.
Build an integration roadmap
But regardless, it's important to build an integration roadmap.
Think about this from a set of information silos, think about your integration roadmap in terms of how it's going to provide benefits, the impact, and the reach, the cost, and the complexity, and ultimately have a prioritized roadmap for your integrations and automations here around building these metrics.
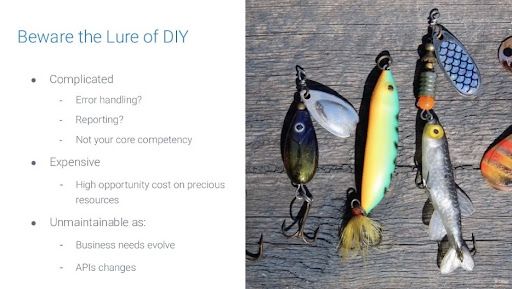
Beware the lure of DIY
You should also beware of the lure of doing it all yourself. When I say do it yourself, here, I'm talking about building an integration.
As product leaders, of course, we work every day with engineering teams and potentially with IT teams as well. You will find the technical folks on your team will say, "Look, we can do this. If data needs to get from point A to point B, no worries, we'll run a script and we'll take care of it."
Complicated
That is technically possible, of course, but it can be a bit complicated, because you have to think about error handling, how you're dealing with reporting, and it's not really the core competency of your business to invest all of this time and effort into integration.
Expensive
More than that, there's a high opportunity cost.
Unmaintainable
The other thing we find, we do this every day, of course, is the business needs change and APIs are always changing. There are always new capabilities or maybe deprecated capabilities in APIs.
So if you're building all this stuff yourself or your internal teams, you've got to know you're signing up for long-term commitment here as well.
Parting words
Utilize product usage data to identify growth potential and churn risk customers
In order to build the metrics that matter, it's a matter of taking product usage data, and a number of other factors and bringing them all together to help identify the growth and the potential churn in your customer base.
The best way to head this off is to understand, what are the things that represent a successful customer?
Empower customers to be self-reliant and foster deeper engagement
One of the most important things here, of course, is to empower customers to be self-reliant and to become deeply engaged with the product.
The worst-case scenario is to have what you think is a happy customer that's really represented by a single user and when that user leaves the company, or there's some M&A, there's not enough power in the organization, not enough footholds to be able to stick in the fight and to own the account moving forward. That inevitably leads to churn.
Use data to understand where to invest
You need to use data. You'll probably end up collecting more than you actually need, but you don't know upfront what the telltale signs are, what exactly the right elements or pieces of data are that best correlate to churn.
So you have to be prepared to collect a little bit more. But once you have, you can use that data to understand where to make improvements in the product, of course, how to drive adoption, reducing barriers to adoption, as well as making sure the customer success team has everything they need to do their jobs, and to do it efficiently so they're not hunting for information and five different systems.
Bring it all together in one place so the customer success team can do their job and do it at scale.
Thank you.